Waterfall Chart in Tableau
Today we’ll be learning to make Waterfall chart in Tableau. I have used ‘World Indicators’ data for the tutorial. Tableau workbook is attached for download.
Today we’ll be learning to make Waterfall chart in Tableau. I have used ‘World Indicators’ data for the tutorial. Tableau workbook is attached for download.
Today we’ll be learning to create Quadrant Chart in Tableau. I have used ‘World Indicators’ data for the tutorial. Tableau workbook is attached for download.
Today we’ll be learning to control a single chart with multiple Dimensions and Measures in Tableau or in other words adding different X and Y axis for a chart. We’ll also learn the use of Parameters in Tableau. Tableau work book is attached for download. I have used Superstore Data for the tutorial.
Today we’ll be learning to use Sheet as Filter in Tableau. This is very useful when you want to show the details under that chart. The Used Workbook is attached for download and I have used Superstore data for tutorial.
Today we’ll be learning how to make Toggle switch or Sheet Selector for worksheets or say how to use ‘Parameter as Filter’. This is very useful when you want to show different sheets with different filters and also the use of Parameters in Tableau. Tableau workbook is attached for download and I have used Superstore data for the tutorial.
We already have three sheets in our workbook.
Today we’ll be learning to create Navigation buttons for Dashboards in Tableau. This Navigation button is very useful for final Presentation and cool technique to make our final dashboard better. Tableau Workbook is attached for download.
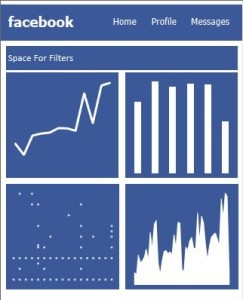
 Due to high demand I have created a Social Media Mobile Template Dashboard. I have made the Charts and Dashboard very fast so I have not used action filters in the dashboard. Download, Share and Reuse the Template according to your need.