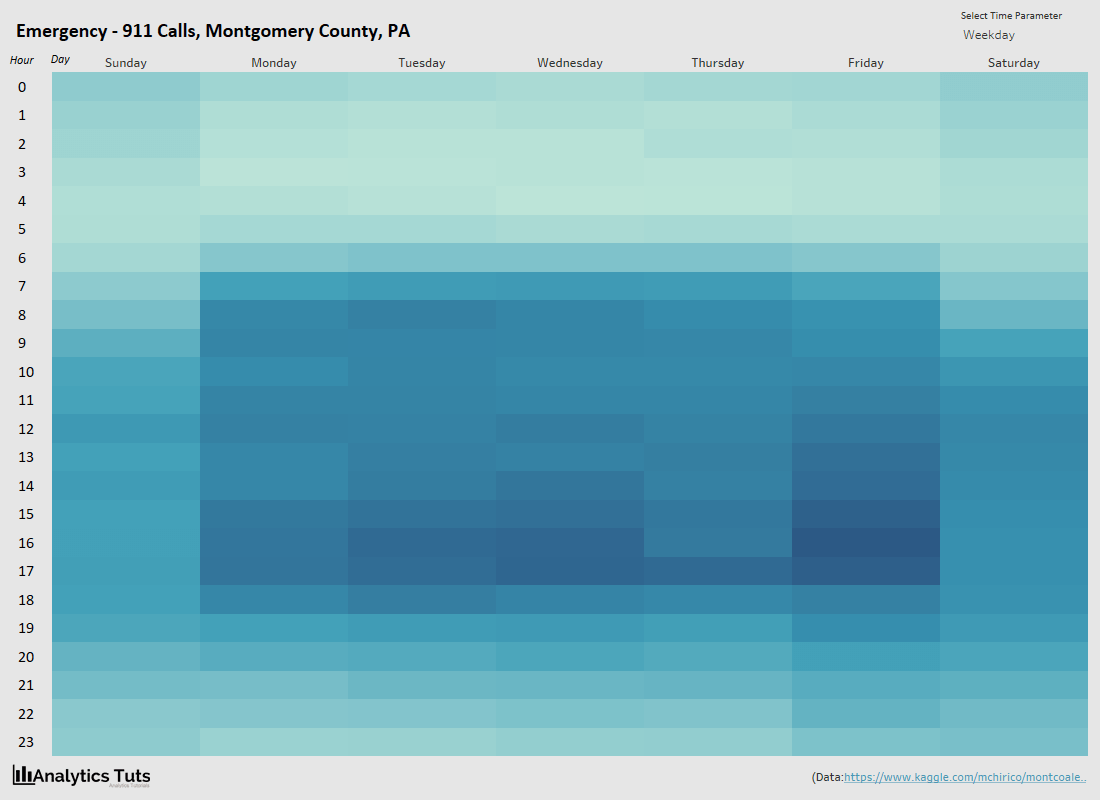
Emergency – 911 Calls Heatmap in Tableau
I’ve created a simple dashboard in Tableau to visualize the frequency of the Emergency – 911 Calls.
Click on the image for interactive dashboard.
I’ll post the tutorial to create the same Heatmap in R.
Thanks for reading! Comment your suggestions or queries.
Keep visiting Analytics Tuts for more tutorials.


Pingback: Creating Heatmap in R – Analytics Tuts